
Question/Discussion
How to use graph and chart
Firstly open the Microsoft Office Power Point

It will be appear like a picture below
I 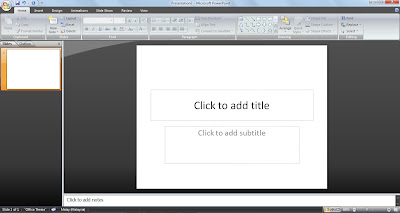
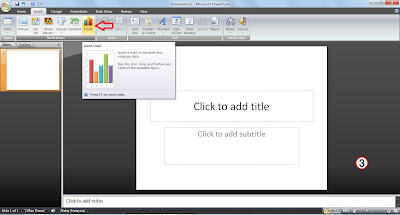
In PowerPoint, click the placeholder that you want to contain the chart.On the Insert tab, in the Illustrations group, click Chart.
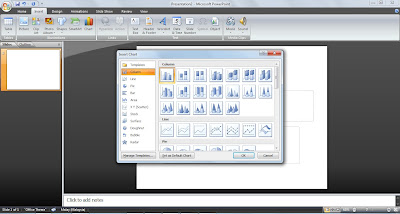
In the Insert Chart dialog box, click a chart, and then click OK.
After click on the chart tab, the types of chart will appear and you can choose the chart that suitable base on your data.
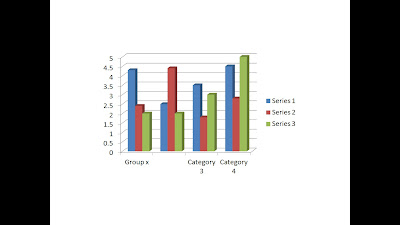
For the example, choose the column chart. After you choose it, Office Excel 2007 opens in a split window and displays sample data on a worksheet.
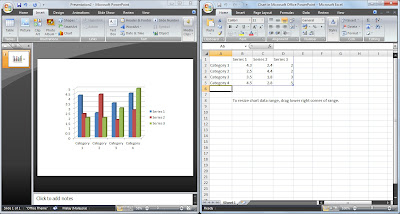
In excel, to edit the sample data, click a cell on the worksheet and then type the data you want.
It will appear like the picture above.
It will appear like the picture above.

You can also replace the sample axis labels in Column A and the legend entry name in Row
Note : After you update the worksheet, the chart in PowerPoint updates automatically with the new
data. When you are finished inputting the data in Excel, on the File menu, click Close and save.
How to Running Presentation.
To running the presentation, open your completed work. And then, click the slideshow button like the picture above.

Go to the Slide Show menu and select View Show or press the F5 funtion key
Single click to advance each slide or let the transition effect you included in the presentation automatically advance the slide
Press the "S" key or Plus ( + ) key to pause the prensentation
Single clicK to continue the presentation
Single click to advance each slide or let the transition effect you included in the presentation automatically advance the slide
Press the "S" key or Plus ( + ) key to pause the prensentation
Single clicK to continue the presentation

Insert answer to your Blog :-


No comments:
Post a Comment